 FSM — Swiss Army Knife for Linux hardware diagnostics
[Home] I [Latest version] I [GitHub] I [Donate] I [Download] I [Screenshots] I [Documentation]
FSM — Swiss Army Knife for Linux hardware diagnosticsFSM is a Linux system profiler for users who need detailed information about their system's hardware and software. It collects information from standard Linux interfaces and presents it in a structured graphical interface. FSM brings information that is normally scattered across /proc, /sys, DMI, systemd, and various system utilities into a single application.
Actual FSM version: .
Compatible with Debian version 11 and later, Ubuntu version 22.04 and later, and Fedora 42 and later. It may also work with other Linux distributions released in 2022 or later.
If you arrived at this page via a modern search engine (Google, Yandex, etc.), please read this article for detailed information about the project before reading the rest of the content on this page.
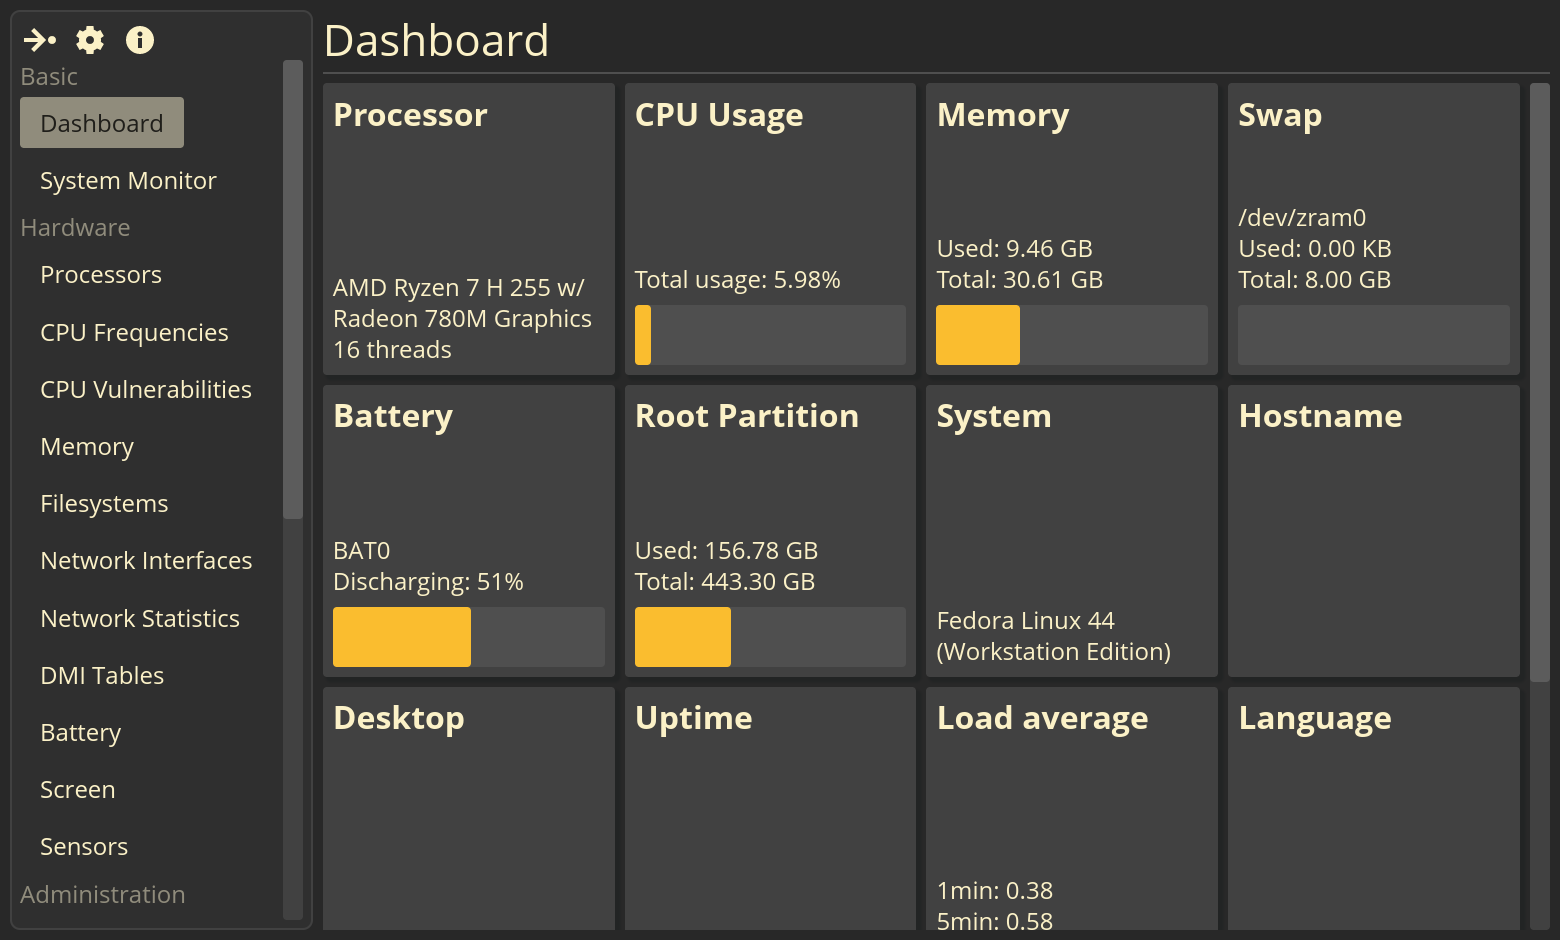 The FSM interface is divided into two part: the left side of the window contains a
sidebar with options for selecting which page to display, while the right side displays the
actual content associated with that page. The home page is System Passport (Dashboard), which
displays key system information in the form of cards. Clicking on each card opens the
corresponding page with more detailed information. The home page is designed to provide an
overview of the system's current status.
The FSM interface is divided into two part: the left side of the window contains a
sidebar with options for selecting which page to display, while the right side displays the
actual content associated with that page. The home page is System Passport (Dashboard), which
displays key system information in the form of cards. Clicking on each card opens the
corresponding page with more detailed information. The home page is designed to provide an
overview of the system's current status.
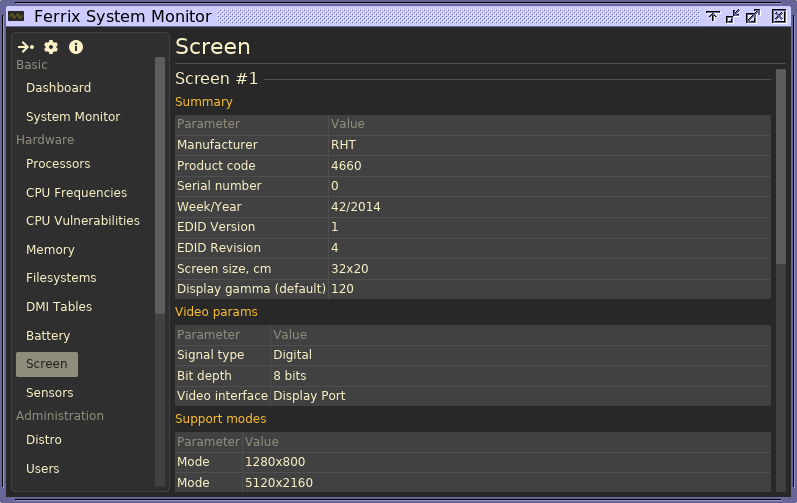 Unlike Hardinfo and similar tools, FSM displays almost everything in the form of
table-based panels. Many tables are dynamically updated as the metrics they contain
change. You can copy text from these tables — click on the desired cell to copy its contents
to the clipboard.
Unlike Hardinfo and similar tools, FSM displays almost everything in the form of
table-based panels. Many tables are dynamically updated as the metrics they contain
change. You can copy text from these tables — click on the desired cell to copy its contents
to the clipboard.
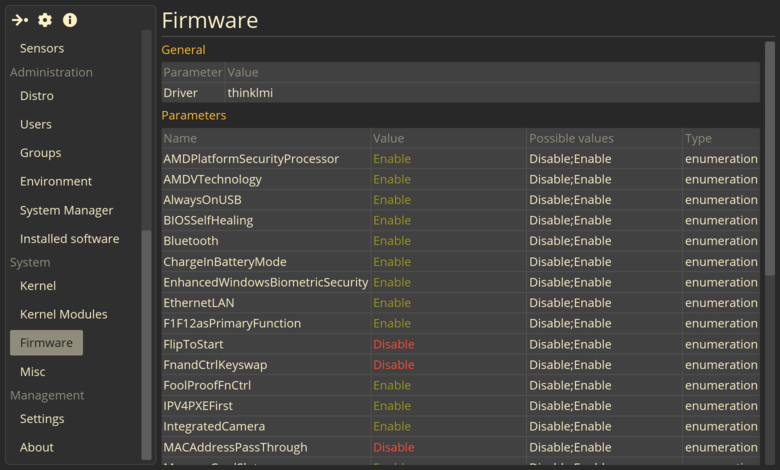 The development of FSM has focused on supporting modern technologies. The program can
display a list of systemd services currently running. Integration with this system
manager is still far from complete — I plan to add a number of additional systemd-related
features in the near future. However, this does not mean that FSM is strictly dependent on
systemd; it can also run on systems without it. Furthermore, FSM is one of the few
programs capable of displaying UEFI settings.
The development of FSM has focused on supporting modern technologies. The program can
display a list of systemd services currently running. Integration with this system
manager is still far from complete — I plan to add a number of additional systemd-related
features in the near future. However, this does not mean that FSM is strictly dependent on
systemd; it can also run on systems without it. Furthermore, FSM is one of the few
programs capable of displaying UEFI settings.
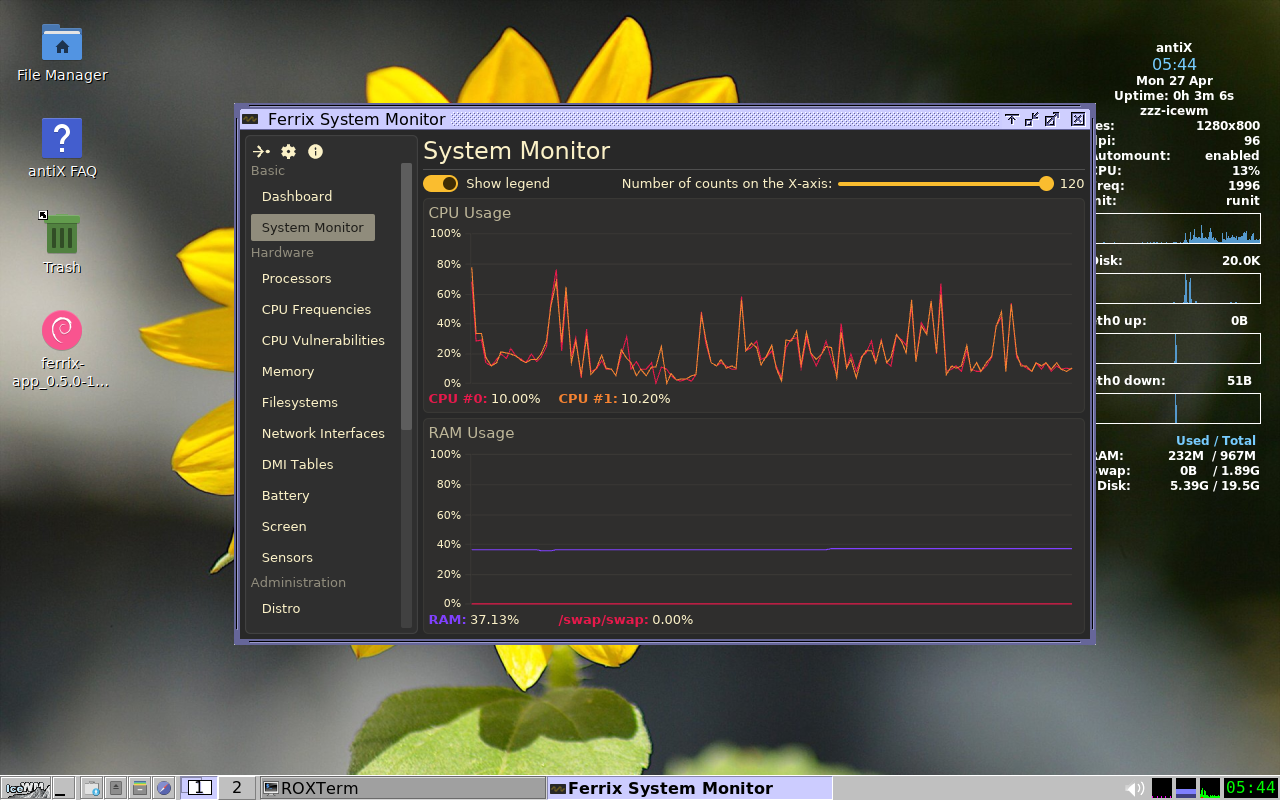
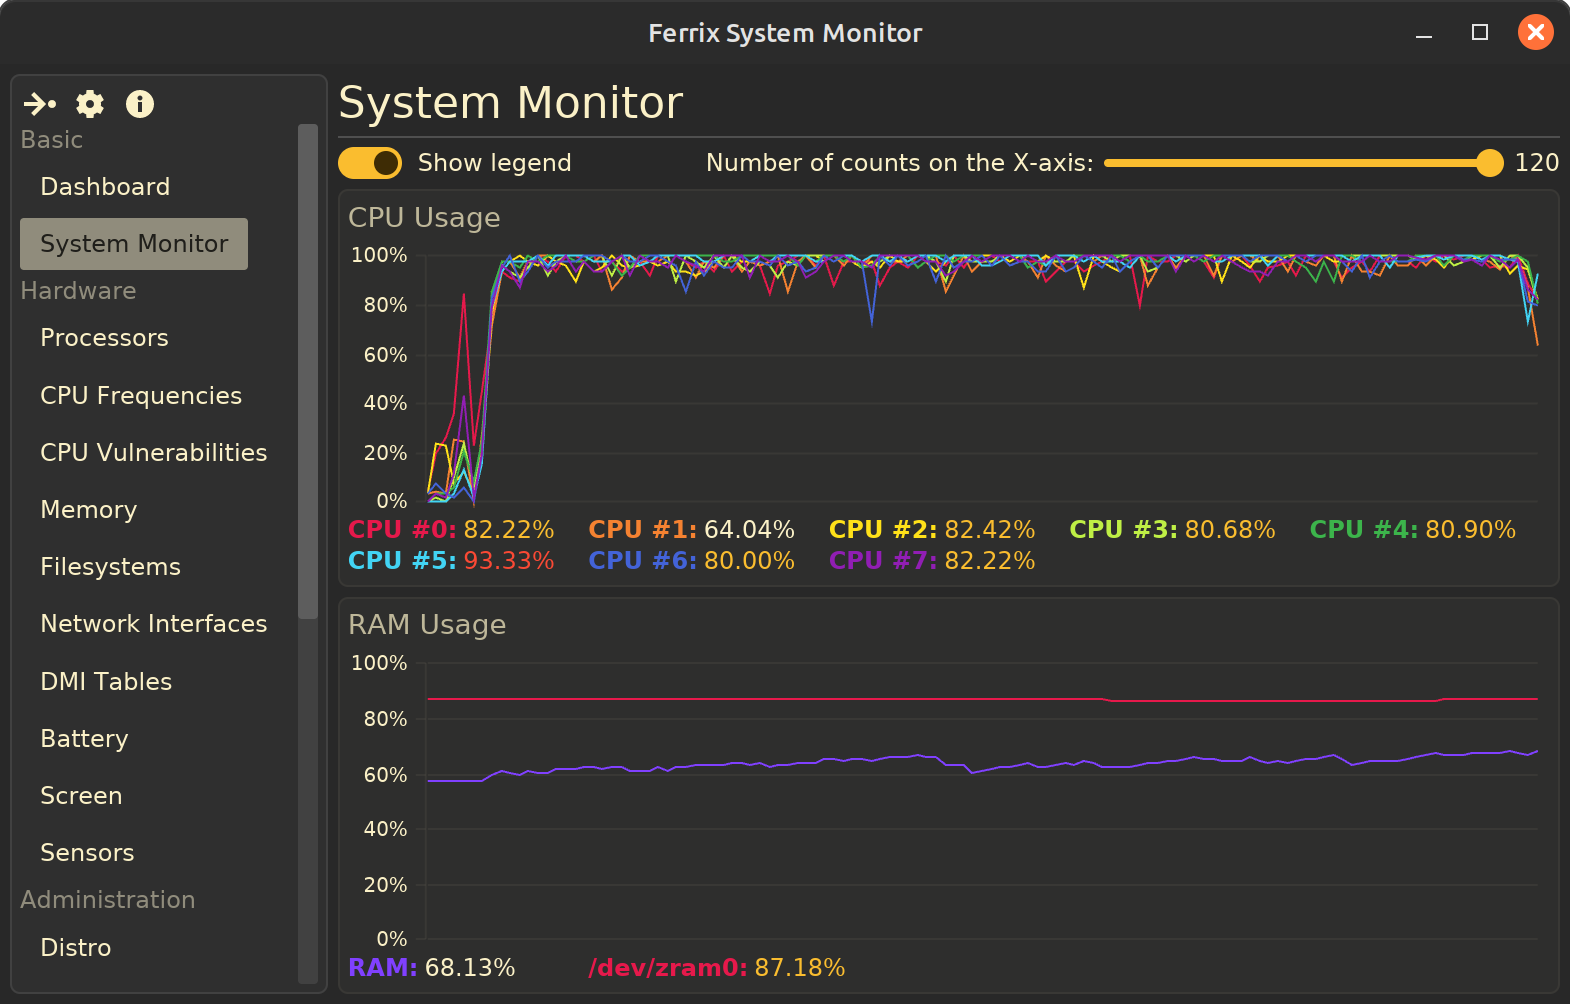 To access the system's health over time, use the CPU and RAM utilization charts. They
are updated in real time. At the bottom of each chart is a legend with color-coded
indicators: white text indicates normal usage, yellow indicates high but not critical usage,
and red indicates resource usage exceeding 95%.
To access the system's health over time, use the CPU and RAM utilization charts. They
are updated in real time. At the bottom of each chart is a legend with color-coded
indicators: white text indicates normal usage, yellow indicates high but not critical usage,
and red indicates resource usage exceeding 95%.
Error text:
[ferrix-polkit] Non-zero return code:
ERROR: ld.so: object 'libapprun_hooks.so' from LD_PRELOAD
cannot be preloaded (cannot open shared object file): ignored.
Error executing /home/${USER}/.local/bin/ferrix-polkit:
    No such file or directory
To fix this error, download the correct ferrix-polkit and place it in the appropriate directory:
wget https://github.com/mskrasnov/FSM/releases/download/v0.7.1/ferrix-polkit
chmod +x ./ferrix-polkit
mkdir -pv ~/.local/bin
mv -v ./ferrix-polkit ~/.local/bin/
I'm developing this program on my own in my free time between studying and working, without reveiving any payment for it. If you like my program or want to thank me, you can contribute whatever you can to its development and support by sending any amount to Boosty.
Boosty: @mskrasnov